BIDS - SSRS Basic Report
SSRS Report Server Project
This article describes how to create an SSRS report without the Report Wizard tool. A SQL view from the AdventureWorks database will be used as the DataSource. Subjects such as Expression (Formula), Headers, Formatting will be covered.
SSRS Report Project Background
The SSRS report in this project uses a View from AdventureWorks called vw_CustomerSalesReport created from tables in the Sales and Person schemas to provide sales person data. This article will run through the Connection, DataSource and tools needed to create a custom report without the need of using the Report Wizard tool to take you step by step through the process.
Using SSRS in a VS Project sans Wizard
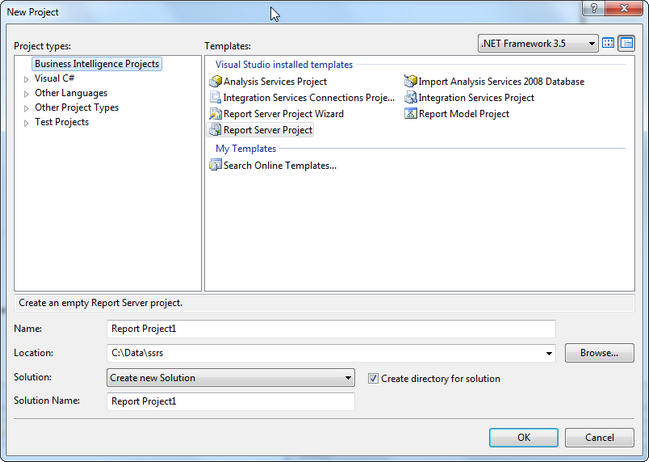
Open Visual Studio and select Open New Project. Select Report Server Project and click OK.
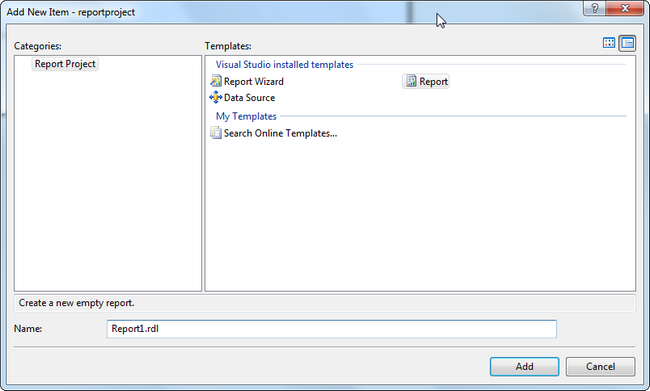
Add a new Report (.rdl type)
SSRS - Setting the Connection and Data Source
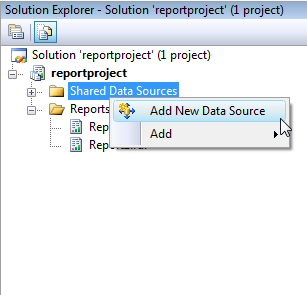
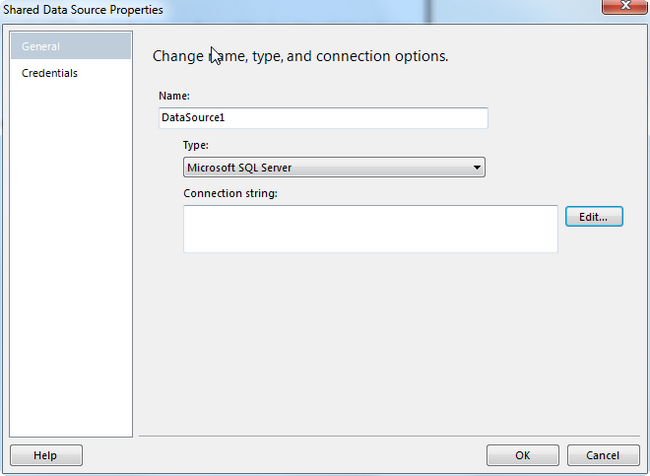
Right click in the Solution Explorer on Shared Data Sources and select Add a new Data Source.
Name Data Source and click Edit button to set connection.
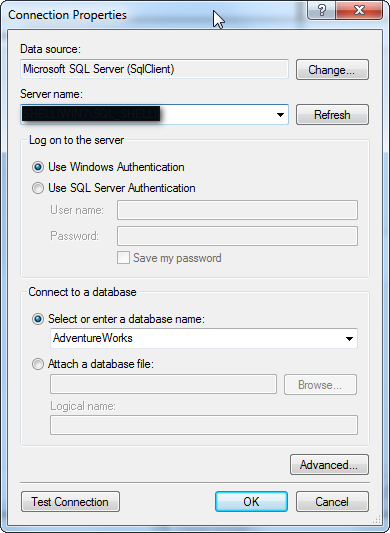
Set Server Name and Database name and click OK.
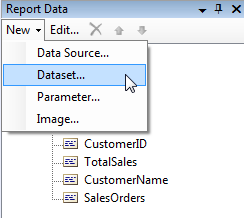
In the Report Data tab, Click on New Data Set to set the data for the report.
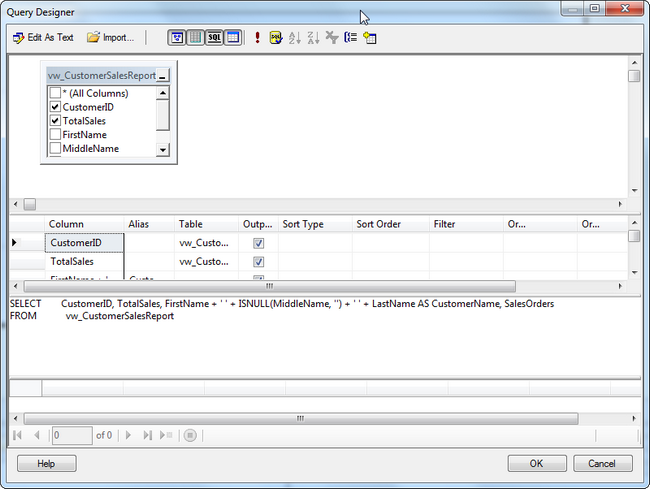
Set the Data Source to the Shared Data Source created. Click the Function (Fx symbol) to set the Query Parameters.
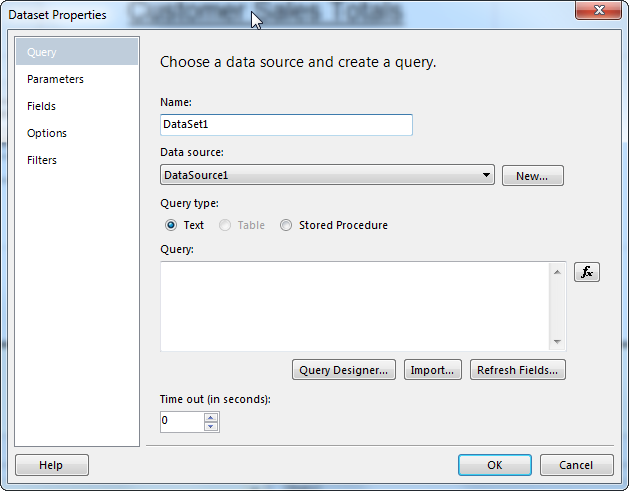
In the Query Designer Click on the Add Tables button and select a table\View. This article uses the vw_CustomersSalesReports.
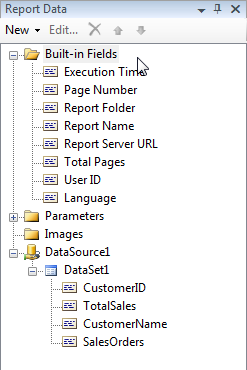
In the Report Data tab, the Dataset has been added.
SSRS - Adding Toolbox Report Items to the Custom Report
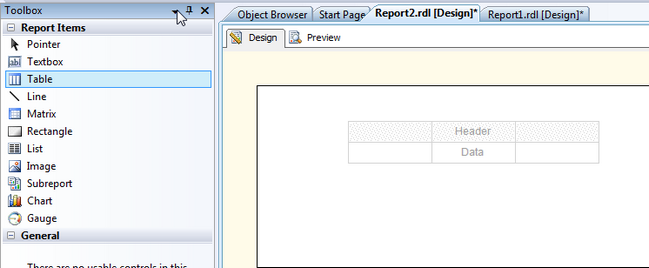
Add a table to the report from the Toolbox.
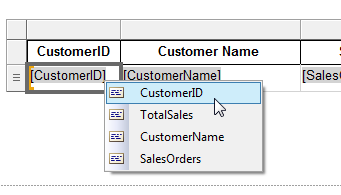
Right click to add fields to the tablix.
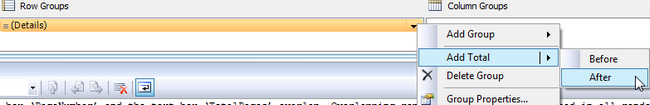
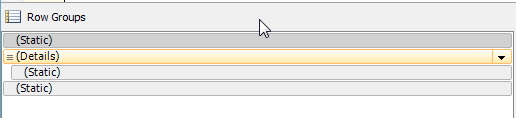
Right click on the Row Groups section of the report and select Add Total -> After to add the Sum of the SalesOrders and the Sum of the Total Sales.
Add Headers to the Tablix in SSRS

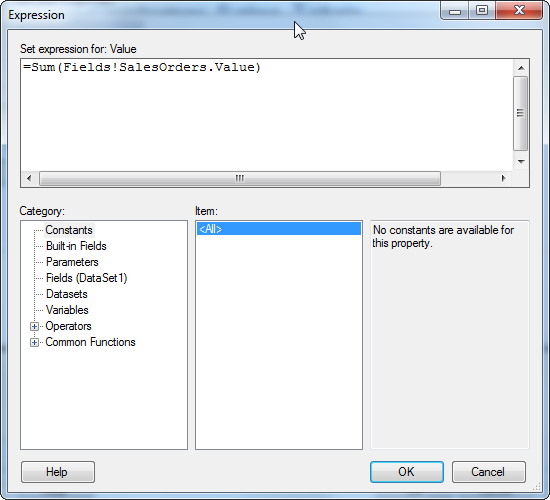
Right click on each box to set the Sum of the Sales Orders and Sum of Total Sales and select Expression and type the formula into the box. Click OK to close when done.
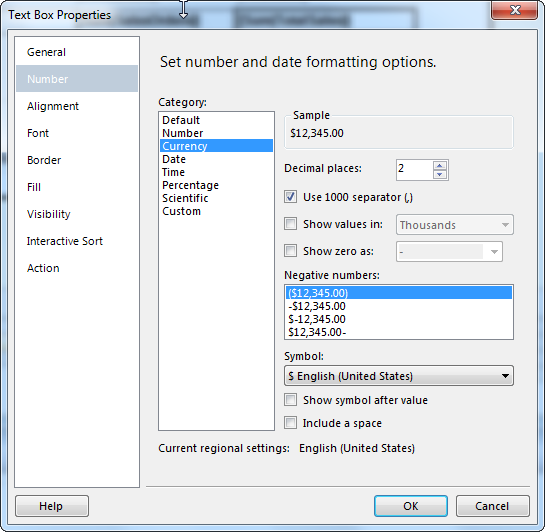
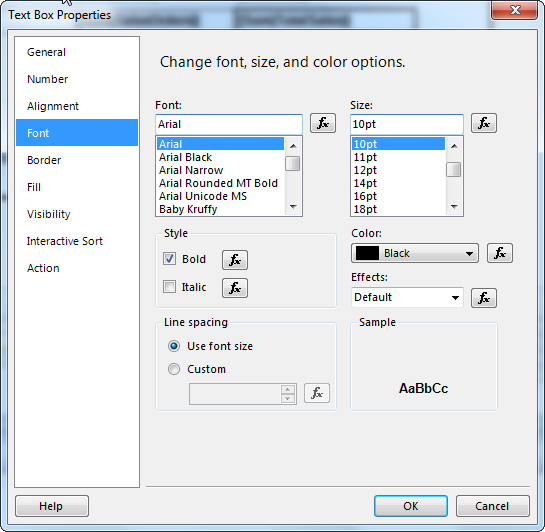
RIght click the box again and select TextBox Properties and format the Number and Font properties of the field.
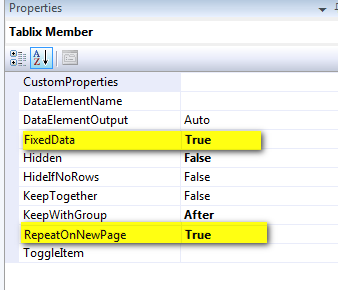
The Headers appear at the top of the report, however they will not appear on every page yet. To get the headers to appear on each page, select the first static Group in Row Group and in the Properties box, set FixedData to true and RepeatOnNewPage to True.
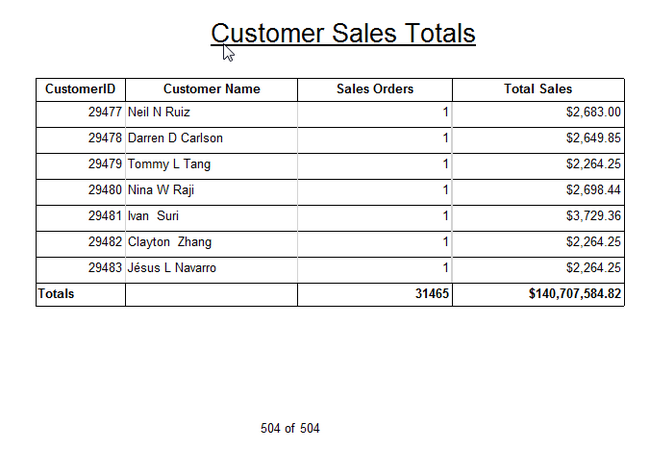
Preview the report to see that the data appears as expected.
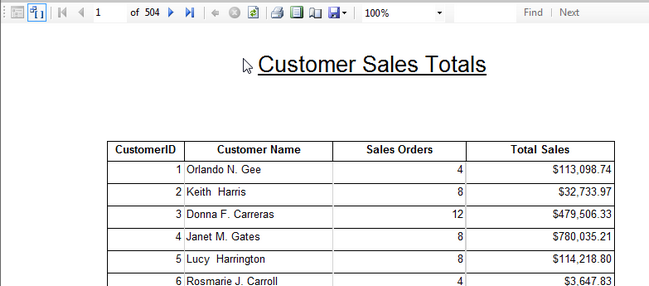
Check the last page for the Headers and the footer with the totals.